
A durable multi-asset approach to income
The Income Fund of America®
INCEPTION DATE
December 1, 1973
IMPLEMENTATION
Consider for an equity-income allocation
OBJECTIVES
To provide you with current income while secondarily striving for capital growth.
VEHICLE
The Income Fund of America
As a multi-asset approach that invests in dividend-paying equities and bonds, The Income Fund of America has navigated different market environments driven by its pursuit of income.
The fund's portfolio managers and investment analysts seek to identify innovative companies across a broad range of sectors.
The power of dividends
Income has been a driver of returns
Dividends have played a significant role in investors' returns over the years. While the share of dividends as a percentage of total returns has fluctuated, historically dividends have provided some downside cushion during difficult periods and have been a source of return in various market environments.
DIVIDEND CONTRIBUTION TO TOTAL RETURN VARIES BY DECADE
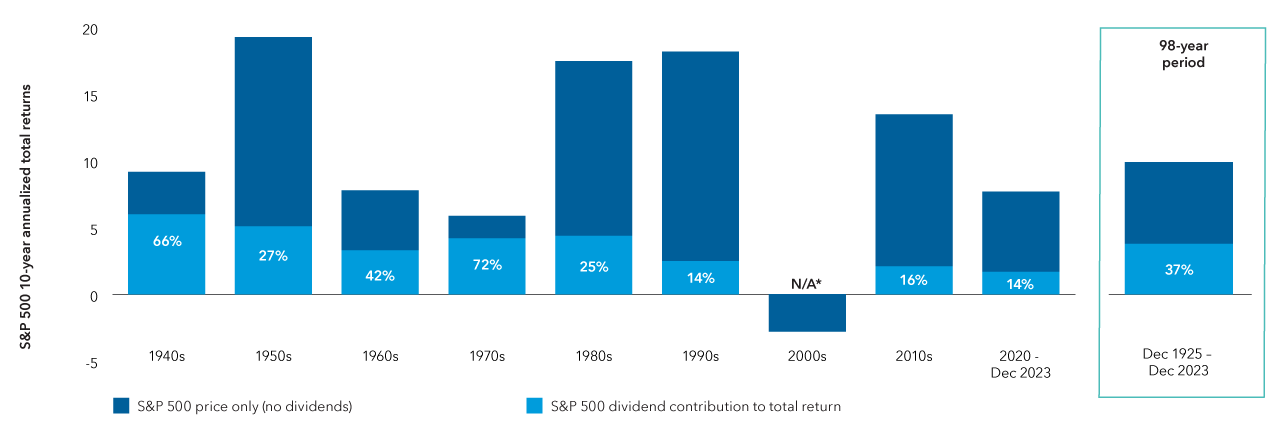
Source: FundStation.
*Total return for the S&P 500 Index was negative for the 2000s. Dividends provided a 1.8% annualized return over the decade. As of December 31, 2023. Past results are not predictive of results in future periods.
A FLEXIBLE APPROACH
A flexible investment approach to equity-income
For 50 years, The Income Fund of America has invested across sectors and industries in pursuit of its income objective while seeking to deliver competitive results for investors. The fund's investment professionals seek companies with sustainable business models, strong financial positions and durable current yield.
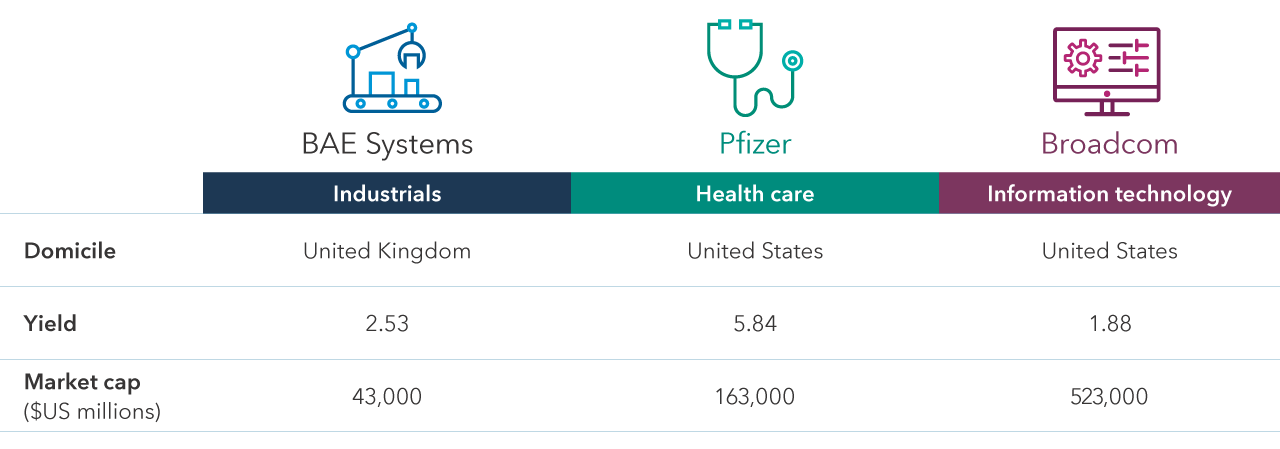
IDENTIFYING LONG-TERM LEADERS IN A BROAD RANGE OF REGIONS AND SECTORS
Examples of top holdings in the portfolios (as of December 31, 2023)1
NUMBER OF COMPANIES WITH DIVIDEND YIELDS HIGHER THAN 3%
Largest dividend payers (as of December 31, 2023)
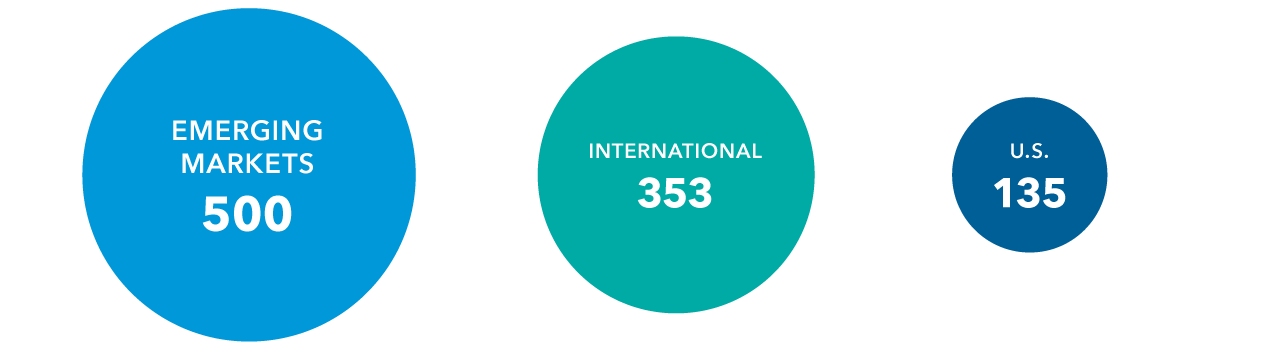
Source: Capital Group, FactSet. Emerging markets reflects MSCI Emerging Markets Index. International reflects MSCI EAFE. U.S. reflects the S&P 500 Index.
FOCUSED ON DELIVERING INCOME
Pursuit of income across asset classes — high-yield representation
Driven by The Income Fund of America’s pursuit of above-average current income, the fund’s portfolio managers may invest up to 20% of fund assets in securities rated BB+/Ba1 or below. The fund balances its higher yielding debt investment with high-quality bonds, aiming to act as a stabilizer for the portfolio. The historically low correlation between dividend stocks and high yield debt can offer a ballast to help address investors’ concerns about equity market volatility.
Returns, risk and yield (%)

Yield advantage (%)
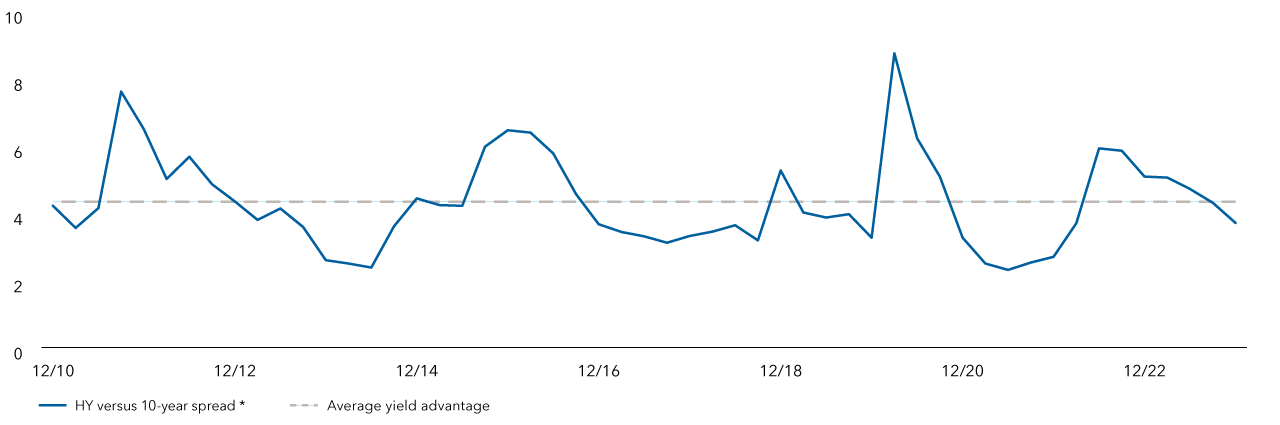
“HY” is represented by Bloomberg U.S. Corporate High Yield 2% Issuer Capped Index.
Sources: Bloomberg Index Services Limited, U.S. Treasury, Morningstar
As of 12/31/23. Volatility here refers to the standard deviation. Annualized standard deviation (based on monthly returns) is a common measure of absolute volatility that tells how returns over time have varied from the mean. A lower number signifies lower volatility. YTW (yield to worst) is the lowest yield that can be realized by either calling or putting on one of the available call/put dates, or holding a bond to maturity. Past results are not predictive of results in future periods.
The Income Fund of America
The Income Fund of America is offered in various share classes designed for retirement plans, nonprofits, and other institutional and individual investors.
1Companies shown are among the top 20 holdings by weight in The Income Fund of America as of 12/31/23: (Broadcom, Philip Morris International, Gilead Sciences, JPMorgan Chase, Microsoft, Comcast, Home Depot, CME Group, EOG Resources, BAE Systems, CVS, Taiwan Semiconductor Manufacturing Co, Lockheed Martin, AstraZeneca, Canadian Natural Resources, Restaurant Brands International, Chevron, Brookfield Infrastructure Partners, Darden Restaurants, Pfizer)
Bloomberg U.S. Corporate High Yield 2% Issuer Capped Index covers the universe of fixed-rate, non-investment-grade debt. The index limits the maximum exposure of any one issuer to 2%. This index is unmanaged, and its results include reinvested distributions but do not reflect the effect of sales charges, commissions, account fees, expenses or U.S. federal income taxes.
MSCI EAFE® (Europe, Australasia, Far East) Index is a free float-adjusted market capitalization weighted index that is designed to measure developed equity market results, excluding the United States and Canada. Results reflect dividends net of withholding taxes. This index is unmanaged, and its results include reinvested dividends and/or distributions but do not reflect the effect of sales charges, commissions, account fees, expenses or U.S. federal income taxes. MSCI Emerging Markets Index is a free float-adjusted market capitalization weighted index that is designed to measure equity market results in the global emerging markets, consisting of more than 20 emerging market country indexes. Results reflect dividends gross of withholding taxes through December 31, 2000, and dividends net of withholding taxes thereafter. This index is unmanaged, and its results include reinvested dividends and/or distributions but do not reflect the effect of sales charges, commissions, account fees, expenses or U.S. federal income taxes.
S&P 500 Index is a market capitalization-weighted index based on the results of approximately 500 widely held common stocks. This index is unmanaged, and its results include reinvested dividends and/or distributions but do not reflect the effect of sales charges, commissions, account fees, expenses or U.S. federal income taxes.
© 2024 Capital Group. All rights reserved.